Updated Economic Analysis: Fall 2025 International Student Enrollment Decline Reveals Drop of $1.1 Billion and Nearly 23,000 Jobs
17% decline in new international student enrollment contributes to lost revenue and jobs.
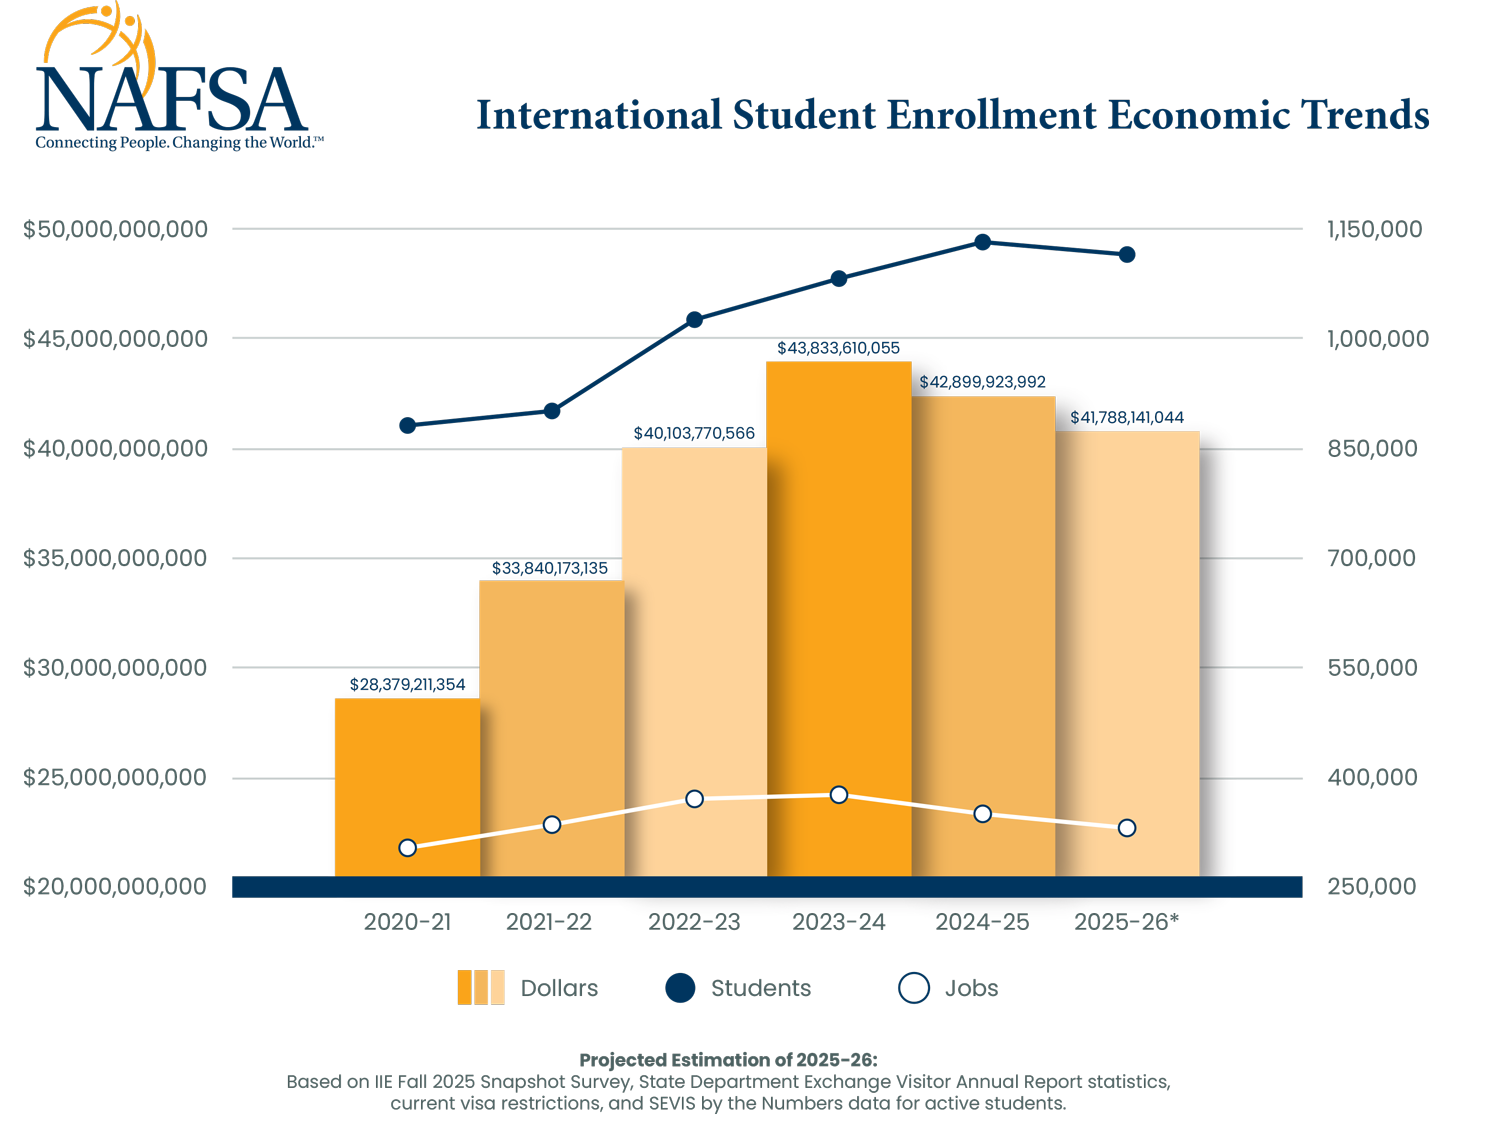
The Findings
Projections by NAFSA: Association of International Educators and JB International based on the Fall 2025 Snapshot on International Student Enrollment published by the Institute of International Education along with the latest available SEVIS and State Department data show downward shifts in international student enrollment and their contributions to the U.S. economy for Fall 2025. SEVIS and visa issuance data early in 2025 suggested flat to modest growth, yet survey findings revealed a 17 percent decline in new student enrollment, contributing to a 7 percent decline in total enrollment minus students on Optional Practical Training (OPT). Our analysis finds this translates into over $1.1 billion of lost revenue and nearly 23,000 fewer jobs.
Estimated Losses by State 2025-26
| State | Losses in US Dollars | State | Losses in US Dollars | State | Losses in US Dollars |
|---|---|---|---|---|---|
| Alabama | $8.8 Million | Kentucky | $7.7 million | North Dakota | $1.5 million |
| Alaska | $258,993 | Louisiana | $7 million | Ohio | $33.2 million |
| Arizona | $26.2 million | Maine | $2.3 million | Oklahoma | $5.8 million |
| Arkansas | $4 million | Maryland | $27.1 million | Oregon | $6.8 million |
| California | $161.9 million | Massachusetts | $92.1 million | Pennsylvania | $53.3 million |
| Colorado | $10.6 million | Michigan | $36.4 million | Rhode Island | $7.1 million |
| Connecticut | $19.4 million | Minnesota | $13.4 million | South Carolina | $5.4 million |
| Delaware | $2.8 million | Mississippi | $2.4 million | South Dakota | $1.7 million |
| District of Columbia | $13.8 million | Missouri | $26.4 million | Tennessee | $10 million |
| Florida | $38.6 million | Montana | $807,373 | Texas | $64.6 million |
| Georgia | $27.3 million | Nebraska | $3.1 million | Utah | $8.2 million |
| Hawaii | $3.2 million | Nevada | $1.8 million | Vermont | $1.5 million |
| Idaho | $2.2 million | New Hampshire | $4.2 million | Virginia | $23.2 million |
| Illinois | $62.1 million | New Jersey | $24.6 million | Washington | $24.6 million |
| Indiana | $25.9 million | New Mexico | $2.2 million | West Virginia | $2.1 million |
| Iowa | $6.9 million | New York | $152.5 million | Wisconsin | $14.8 million |
| Kansas | $6.0 million | North Carolina | $23 million | Wyoming | $662,175 |
| Total Loss | $1.1 billion |
What's Driving the Decline?
- Graduate and non-degree enrollment declines: Graduate enrollment fell 12 percent and non-degree students declined 16 percent, both cutting into higher-spending populations that typically contribute more through tuition, living costs, and accompanying dependents.
- Enrollment mix affects spending: The increased share of students pursuing OPT (up 14 percent) reduced the amount of campus-based spending (such as tuition, housing, dining).
- Inflation at about 3 percent: Rising costs slightly softened the decline in overall economic impact, but not enough to make up for the drop in higher-spending graduate and non-degree populations.
A 2 percent increase in undergraduate enrollment cushioned the losses since undergraduates receive much less in institutional funding than graduate students. The increase may have been due to earlier student decisions and visa appointments occurring before various administrative actions took place this summer.
Policy Solutions
To address this decline, NAFSA urges the administration to:
- improve visa availability and processing for all F and M students and J exchange visitors;
- exempt F and M students as well as J exchange visitors from the travel ban affecting nationals from 19 countries while maintaining background checks and vetting required for visa issuance;
- protect F-1 student access to Optional Practical Training; and
- preserve the current Duration of Status policy.
Congress also should pass the Keep STEM Talent Act and provisions that extend dual intent and create a path to green card for F-1 students included in the Dignity Act.
Methodology
JB International based its Fall 2025 economic analysis using the following sources: SEVIS Data Mapping Tool, State Department Annual Exchange Visitor Report, Open Doors 2025 (academic year 2024-25), IIE Fall 2025 Snapshot on International Student Enrollment, Common Data Set data on institutional funding for international undergraduate students, Monthly Nonimmigrant Visa Issuance Statistics, and the NAFSA International Student Economic Value Tool powered by JB International.
Media Inquiries
Members of the media are encouraged to contact NAFSA's media relations team with additional questions or to request an interview.